Dashboard
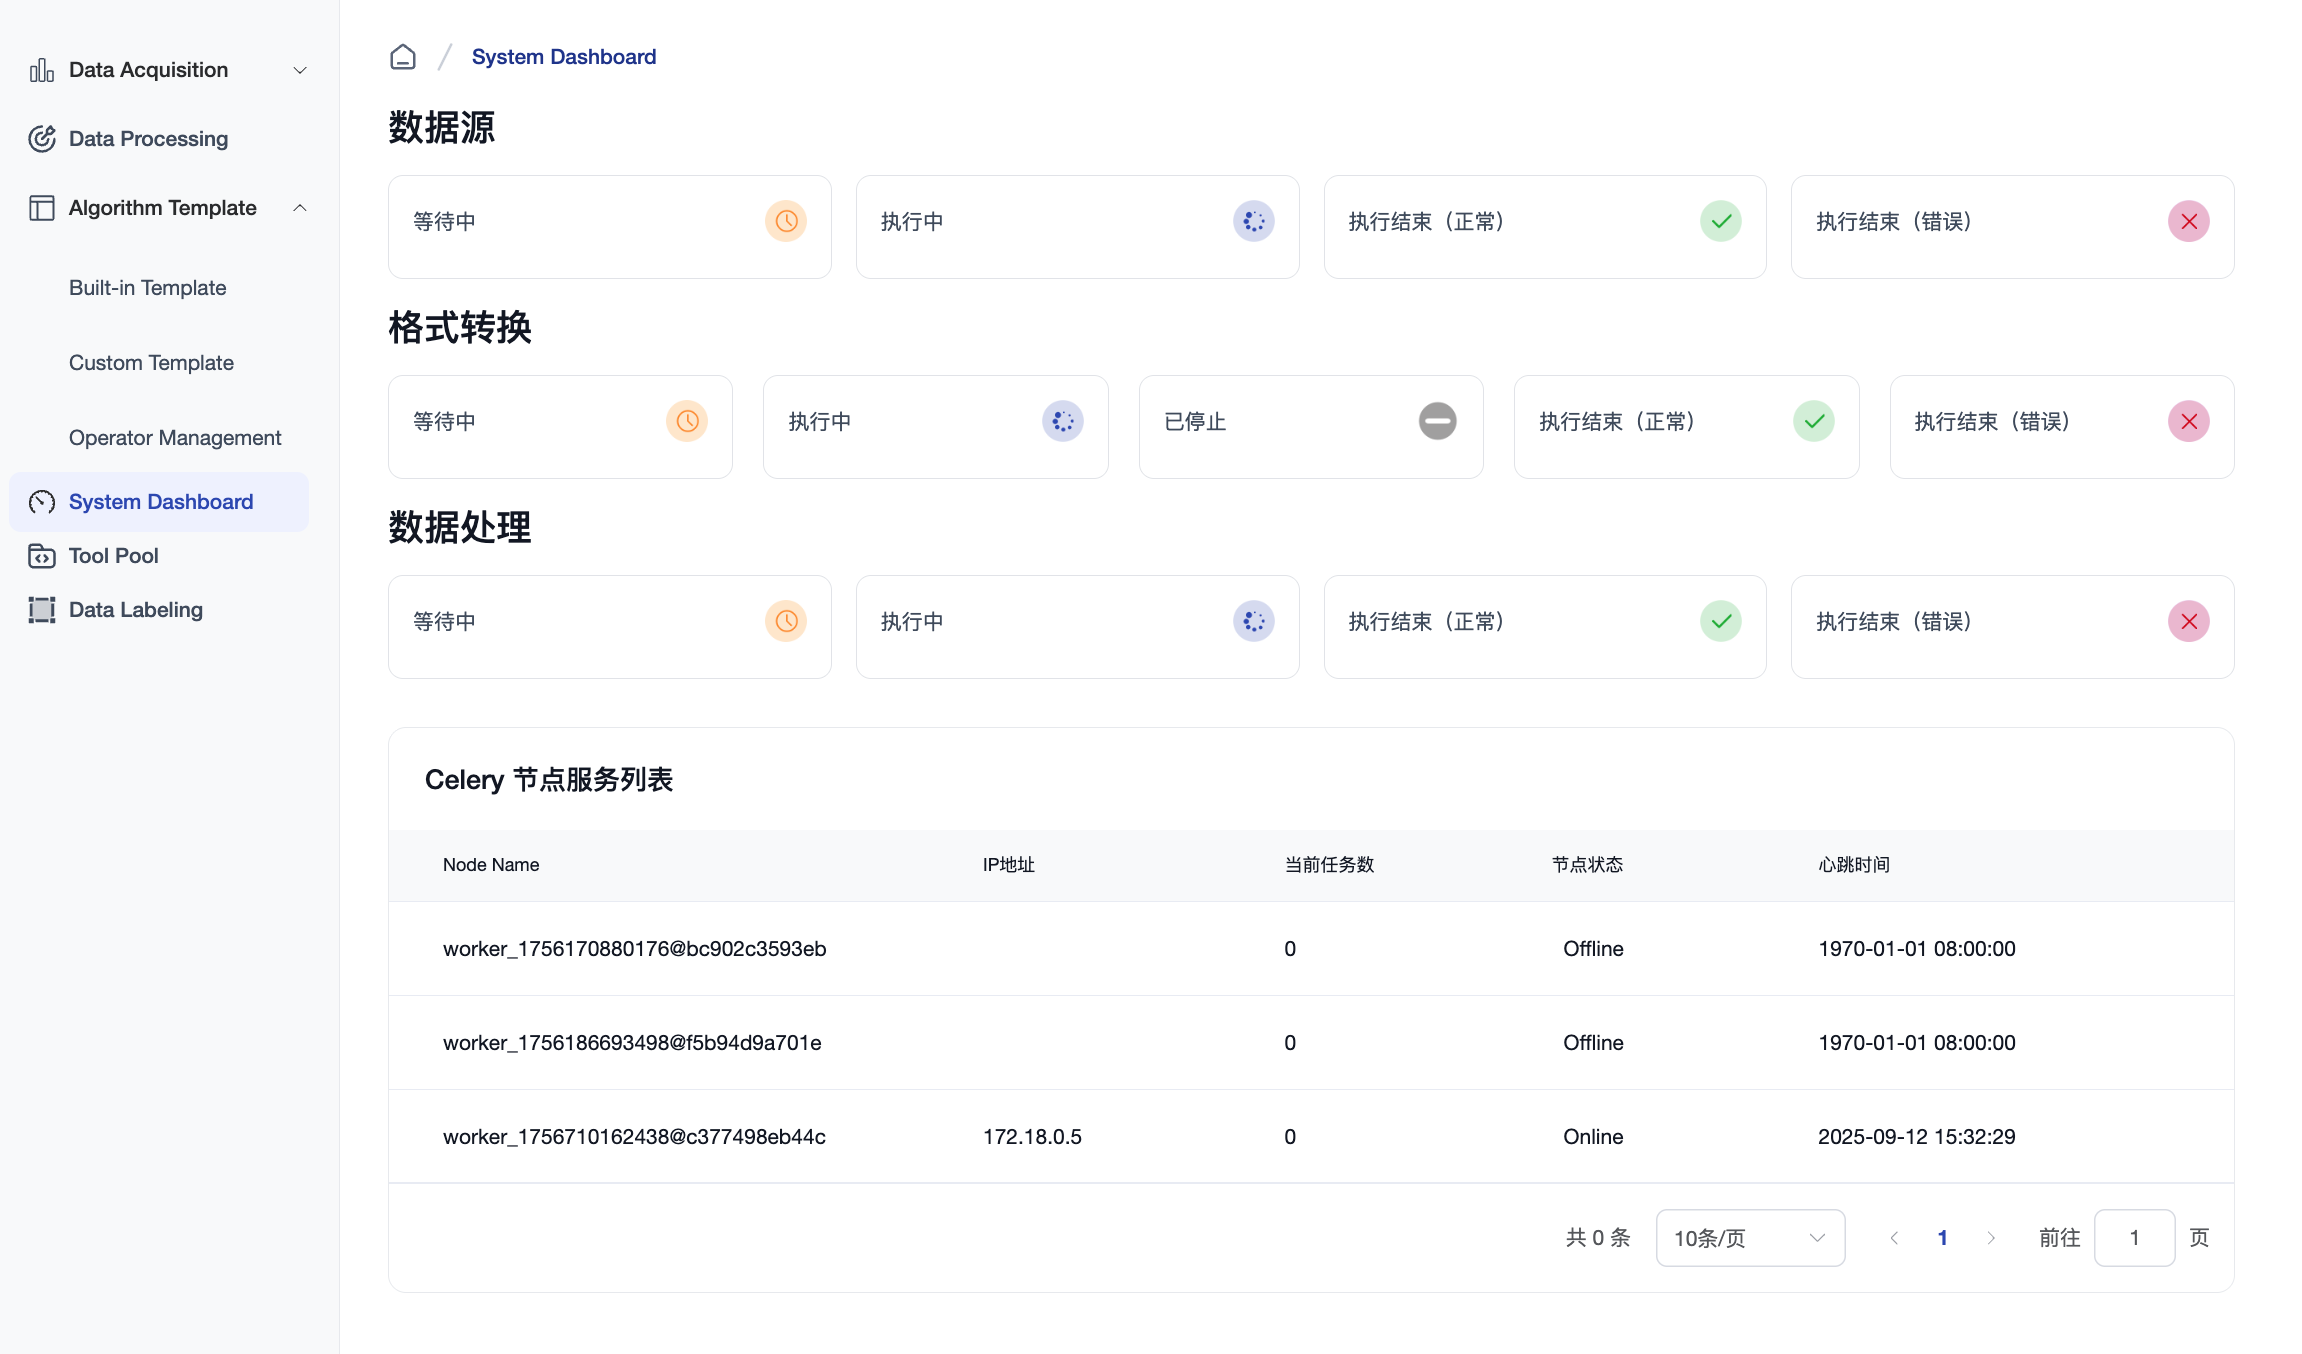
Clicking System Dashboard in the left-hand menu allows you to view the overall status of tasks across the three main modules: Data Sources, Format Conversion, and Data Processing, including the number of tasks that are pending, in progress, completed, or failed. You can also view a list of all Celery service nodes, including details such as node IPs, number of tasks being executed, and current status.