Monitoring, Logs, and Troubleshooting
Gateway Overview shows traffic, response behavior, and upstream health. Request logs help investigate individual calls. Personal and organization bills show charges. These sources answer different questions.
Review runtime metrics
Open Admin Console → AI Gateway → Gateway Overview, choose a time range and model, then inspect the charts.
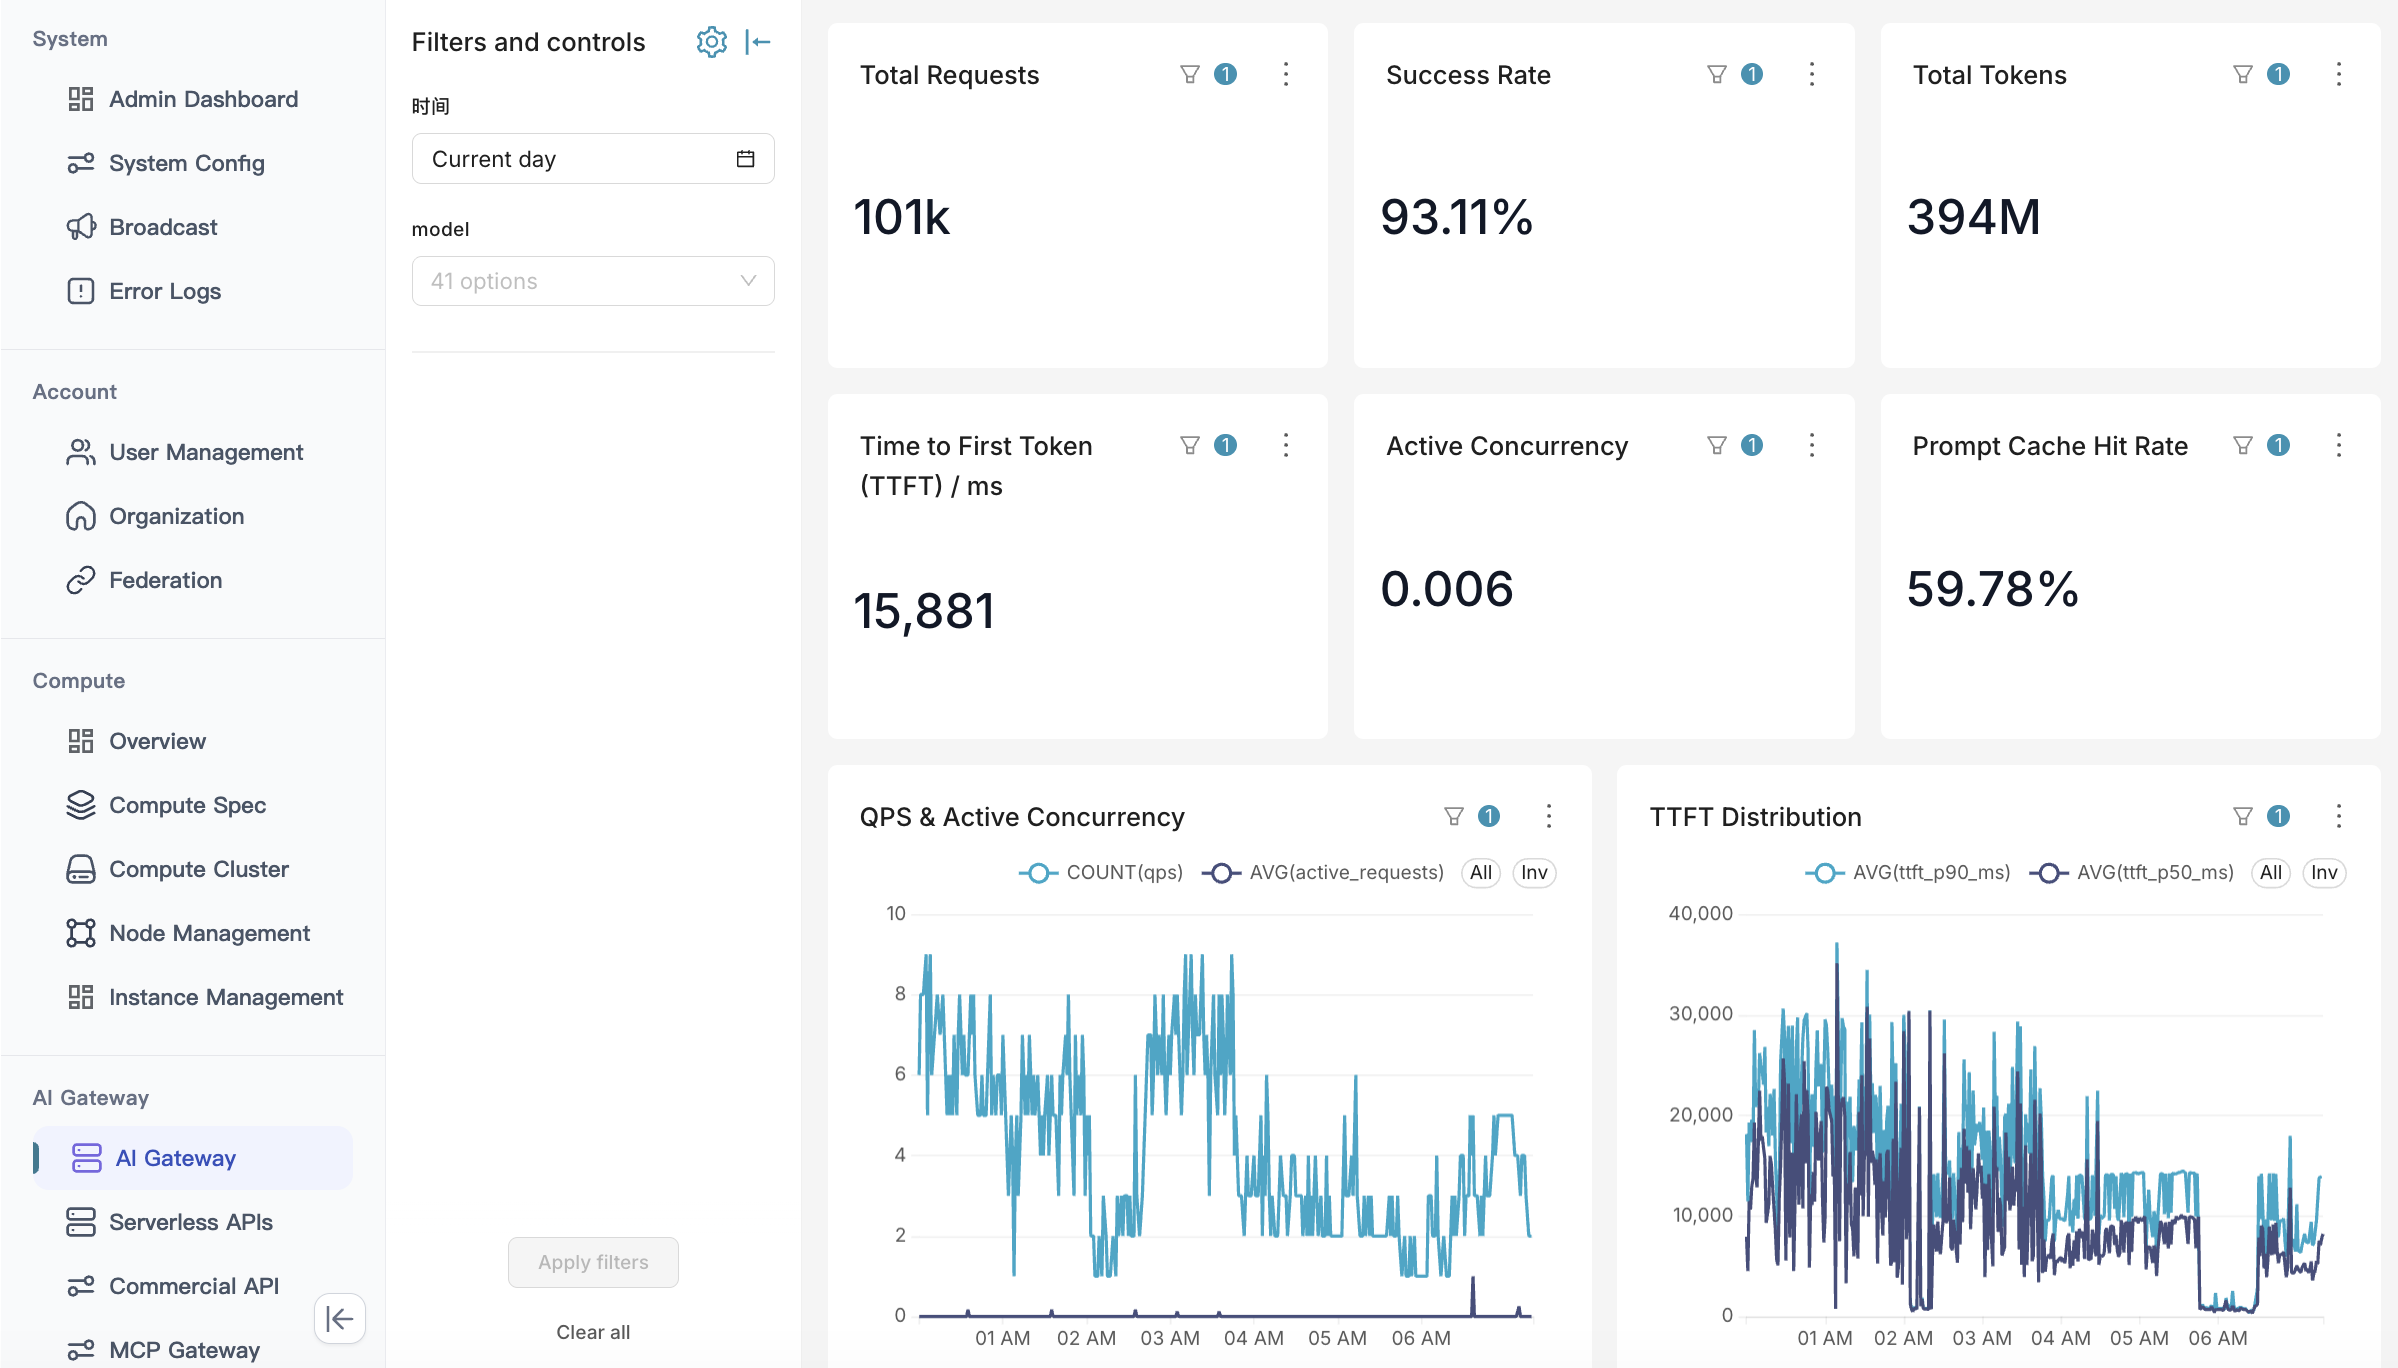
| Metric | Purpose and boundary |
|---|---|
| Time to first token (TTFT) | Time until initial output, distinct from total response time |
| Concurrency | Active request or connection load, indicating how busy the service is |
| Prompt cache rate | Reuse of input context cached by the upstream |
| Traffic and latency trends | Identify when responses slow down relative to traffic |
| Upstream health | Healthy, sub-healthy, and unavailable nodes |
| Top five upstream channels | Traffic share and success rates for checking distribution |
See AI Gateway Administration for the complete screen guide.
Request and instance logs
Gateway records can contain prompts, tool calls, and outputs for auditing, quality analysis, and authorized downstream data analysis. Access methods, fields, and retention depend on deployment configuration; see Content Safety and Data Handling.
Self-hosted inference container logs are available on instance pages; see Using Endpoints. Use container logs for startup and runtime issues, request records to analyze model replies, and consumption bills to reconcile charges.
Troubleshoot by symptom
| Symptom | First checks | Next step |
|---|---|---|
| Authentication fails | Gateway key type, expiry, revocation, request headers | Identity and Access |
| Model missing or access denied | Model name, enabled status, caller identity, endpoint visibility | Connect and Call Models |
| Allowance or rate limit reached | Key allowance, account balance, and rate-limit configuration separately | Limits, Metering, and Costs |
| Upstream failure | Endpoint address, credentials, health, and backups | Routing and Reliability |
| Slow first token | Traffic, concurrency, cache rate, and instance state in the same period | Optimization |
| Interrupted stream | Connection, client timeout, upstream errors, content checks | Preserve partial output and avoid unbounded retries |
| Unexpected charge | Key owner, time range, rate, units, retry history | Reconcile consumption against billing |
If a response contains a platform-specific code, consult Error Codes. For upstream HTTP or streaming errors, follow the response details and the corresponding service’s API instructions.
Information for support
Provide the time and time zone, model, interface, request mode, error status, and minimal reproduction steps. Preserve a request identifier when one is returned. Remove credentials and handle request bodies according to enterprise policy before sharing logs.